
Overview
Key Features
-
📊 Real-Time Cost Analytics
Visualizes GCP cost breakdowns across services, projects, and regions with interactive charts and tables. -
⚙️ Resource Underutilization Detection
Automatically identifies low-usage components based on dynamic thresholds for CPU, memory, disk I/O, and network traffic. -
💡 Optimization Insights & Suggestions
Provides actionable, categorized recommendations such as rightsizing, instance scheduling, and resource decommissioning. -
📈 Cost Forecasting (2024–2025)
Predicts upcoming cloud expenses using a statistical forecasting approach — with results displayed in line graphs and tables. -
🌍 Cost Distribution Analysis
Interactive Plotly visualizations to explore service-wise and region-wise cost patterns and identify top contributors. -
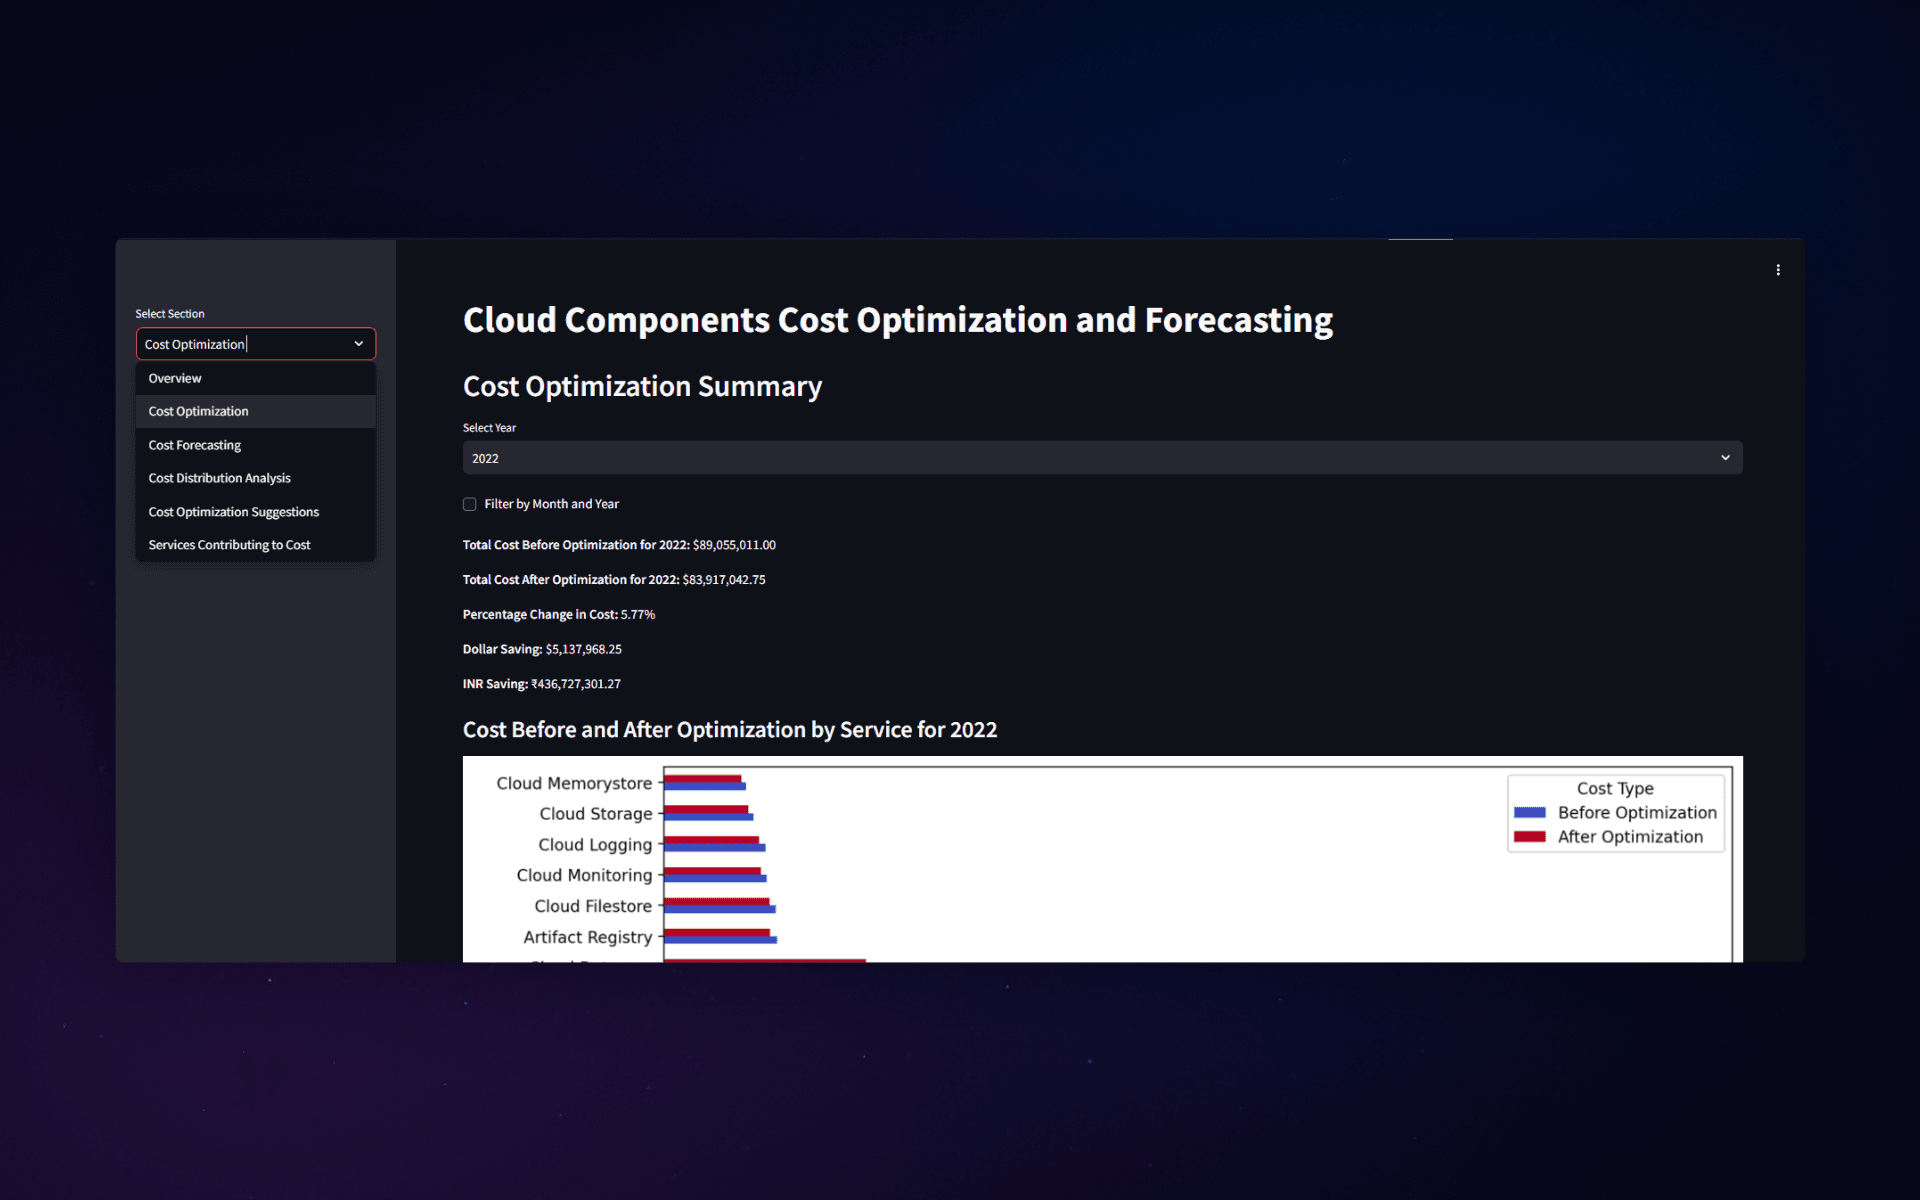
💰 Optimization Impact Calculation
Calculates pre- and post-optimization costs, percentage savings, and potential INR/USD conversions for financial insight. -
🔍 Service-Level Insights
Filters cost data by month, year, or service, enabling deep drill-down analytics for each GCP component.
Technologies Used
- Frontend & Visualization: Streamlit, Plotly Express, Matplotlib
- Backend & Analytics: Python, Pandas, NumPy
- Cloud Platform: Google Cloud Platform (Compute Engine, BigQuery, Cloud Storage, Monitoring)
- Forecasting Logic: Statistical trend modeling using NumPy and time-series resampling
Application Architecture
- Loads GCP billing CSV reports.
- Converts and cleans raw utilization data (e.g., bytes → GB, timestamps → datetime).
- Applies thresholds for CPU, Memory, Disk I/O, and Network utilization.
- Calculates “Optimization Factor (%)” and computes Optimized Cost ($) dynamically.
- Uses Streamlit for UI components and Plotly for interactive visualizations.
- Provides multi-tab navigation:
- Overview
- Cost Optimization
- Forecasting
- Distribution Analysis
- Optimization Suggestions
- Service Cost Breakdown
- Generates forward-looking monthly cost predictions (Jan 2024–Dec 2025).
- Displays tabular and graphical forecast trends.
- Displays tailored suggestions for optimizing CPU, memory, and disk performance.
- Helps identify cost-heavy services and recommends corrective actions.
Challenges and Learnings
- Data Consistency: Cleaning and aligning GCP cost data across multiple regions and time frames required robust preprocessing logic.
- Threshold Tuning: Defining dynamic thresholds for “underutilized” resources to avoid false positives.
- Forecasting Stability: Generating meaningful predictions with minimal historical data required careful normalization.
- Visualization Performance: Optimizing Plotly and Matplotlib performance for large datasets in Streamlit.
Outcome
- Reduced manual cloud cost analysis time by ~60% through automation and visualization.
- Enabled predictive cost awareness for 12+ months ahead.
- Achieved an estimated 25–35% potential savings via actionable optimization insights.
- Empowered both technical and financial teams with accessible cloud insights through an intuitive dashboard.
Conclusion
By integrating forecasting, analytics, and automation in one interface, it provides a complete solution for cloud cost governance and efficiency.